









BLOG
PoE Stress Testing: How Do You Find Packet Errors That Appear Only Under Load?
QUICK LINKS

A powered link can look healthy at idle and show failures only while the access point is busy. Throughput loss at the application can come from congestion, physical link errors or a brief restart. Test traffic and electrical behavior on the same timeline to identify which condition occurred.
Quick answer. Establish a wired baseline, run separate traffic and power-load cases and then combine them. Compare negotiated rate, interface counter deltas, link events and available PoE evidence with synchronized timestamps.
Why This Topic Matters Now
Multigigabit access points can be deployed over retained cable infrastructure. The longest or most complex channel in that deployment may behave differently from a reference bench path. Wireless client throughput can also change with radio conditions even while the wired link remains healthy. A controlled test gives engineering a way to separate those effects.
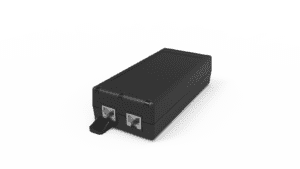
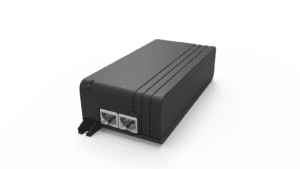
Capture switch port, access point, firmware, injector and cable identity before starting. Use the POE29U-1AT(PL)D-R page and datasheet to identify the intended injector and verify the relevant model details. The product documentation describes component capabilities, while the test checks the complete path.
For the wider decision, start with the complete injector qualification process. Then connect this result with negotiated-rate troubleshooting. The earlier multigigabit poe guide provides the broader engineering background.
- Confirm powerPSE class, PD requirement and channel
- Verify the wired linkNegotiated rate and interface counters
- Test service recoveryTraffic, restart and application readiness
Conceptual qualification workflow. Each result belongs to the exact tested configuration.
What should the baseline contain?
Use known-good endpoints and a reference channel. Record negotiated rate and the starting values of the interface counters at both ends. Note the traffic generator, direction and duration, then repeat the same case with the installed channel. If an instrument is inserted into the link, qualify it for the data rate and powering setup and record its location.
| Record | What it helps isolate |
|---|---|
| Negotiated rate and link events | Rate fallback or link re-establishment |
| Interface errors | Physical-layer symptoms and direction of observation |
| Drops and queue counters | Congestion or buffering under offered load |
| PD and power events | Startup, reboot or power interruptions |
Counters vary by vendor. Check the device documentation for what each field represents. Record differences over the exact test interval instead of comparing total counts from devices that have been online for different lengths of time.
How do you separate wired traffic from access point power load?
Run wired traffic with the access point in a stable state to establish how the data path behaves. Separately exercise representative endpoint functions and observe power or feature events. Then combine the intended traffic and endpoint duty. Keep each phase long enough for the program’s acceptance criteria and label the setup, start and stop.
| Phase | Hold steady | Observe |
|---|---|---|
| Idle baseline | Topology and configuration | Initial counters and link state |
| Traffic only | Endpoint operating mode | Error and throughput changes |
| Endpoint activity | Defined traffic level | Power or feature state changes |
| Combined case | Released channel | Correlation of events and repeated failures |
If a failure appears only during combined activity, repeat that case and change one controlled variable. Compare a reference cable, a different approved switch port or an alternative test location while documenting each change. A repeatable difference is more actionable than a one-off symptom.
What observations distinguish common failure modes?
A queue drop under a known high offered load has a different investigation path from new physical receive errors. A series of interface down and up events suggests link disruption. A reset with a power event deserves review of the PSE, cable and PD behavior. A stalled application with no new link errors can point the investigation toward control-plane or application state.
Use the event order to guide the next check. If the device rebooted before the link dropped, inspect why it rebooted. If physical errors increased before an application timeout, reproduce the link condition on a reference channel. Avoid assigning causality from a timestamp when device clocks or collection intervals differ.
What belongs in the repeatable stress test record?
State the topology, power configuration, traffic profile, counter definitions and collection interval. Attach baseline and failing captures and describe the acceptance decision. Include the cable and hardware identifiers so the case can be repeated on a field return or replacement unit.
Define which changes should trigger review. A firmware update that changes radio or port behavior can affect the combined test. A different patch lead or endpoint revision can change the link path. Test the released setup after the corrective change and preserve the reproduction steps.
Key Takeaways
Compare a controlled wired baseline with installed conditions. Correlate link, power and application observations and keep separate evidence for queue drops, physical errors and resets.
Product and OEM Resources
FAQs
Do dropped packets always indicate an Ethernet physical error?
No. Queues, endpoints and higher-layer behavior can also drop packets. Review the relevant counter definitions and timing.
Can a power test alone detect a weak multigigabit link?
Verify power and Ethernet link behavior independently, then run the combined case.
Should old counter totals be compared directly?
Use counter deltas over the same defined test interval and document any resets or rollover.