








BLOG
240W USB-C Ripple Testing: Is Your Probe Setup Creating a False Failure?
QUICK LINKS
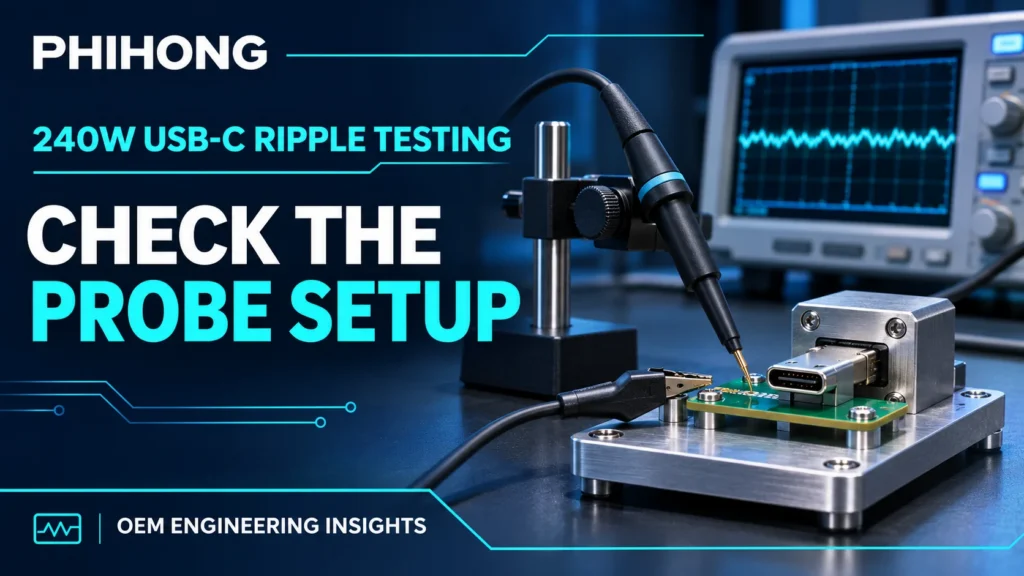
Quick answer: A 240W USB-C ripple measurement can show an apparent failure because the probe path, bandwidth, fixture or instrument noise differs from the specified method. Reproduce the defined measurement boundary and settings before deciding whether the observed noise exceeds the model requirement.
For the AA240U-59FKEA-R adapter, the source describes a 20MHz bandwidth limit and connector capacitors. Its production-test pages also distinguish SPR and EPR ripple values. A full-bandwidth capture or a long return lead may be useful for debugging, but it does not automatically reproduce that method.
The right response to a noisy trace is neither immediate rejection nor indiscriminate filtering. Preserve the observation, identify the measurement contribution and repeat the comparison with the correct setup. A real remaining excursion then becomes a more useful engineering issue.
Reconstruct the stated ripple method before changing the unit
The AA240U technical datasheet specifies a 20MHz oscilloscope bandwidth, a 0.1µF ceramic capacitor and a 10µF low-ESR electrolytic at the connector. It describes the Type-C cable test condition as 100mΩ. These details belong together with the output profile, input and load condition. Changing the bandwidth or measurement location while keeping the same numeric limit creates a different comparison.
The production-test pages list 200mVp-p for the SPR outputs and 300mVp-p for the EPR outputs. Use the relevant profile entry rather than treating one value as a universal family limit. Keep peak-to-peak units explicit. A millivolt RMS reading, an averaged trace and a peak-to-peak measurement are different quantities and should not be substituted without an agreed conversion method and waveform context.
Record capacitor identity and placement rather than writing only “bypass fitted.” Lead length and position can matter for the observed signal. Use the agreed fixture and connection method, and preserve a record of any difference. If the supplied test information is incomplete for production acceptance, ask for the fixture details instead of inventing them.
| Source item | Stated condition or value |
|---|---|
| Scope bandwidth | 20MHz |
| Connector bypass | 0.1µF ceramic + 10µF low-ESR electrolytic |
| SPR production-test entries | 200mVp-p maximum |
| EPR production-test entries | 300mVp-p maximum |
Why This Matters
- The numeric limit is meaningful only with the profile and method attached.
- A different bandwidth or unit can create a false comparison before probe quality is even considered.
What OEMs Should Do Now
- List profile, input, load, bandwidth, sense point and connector capacitors on the result.
- Use the corresponding peak-to-peak limit from the current agreed source.
FEATURED PRODUCTS
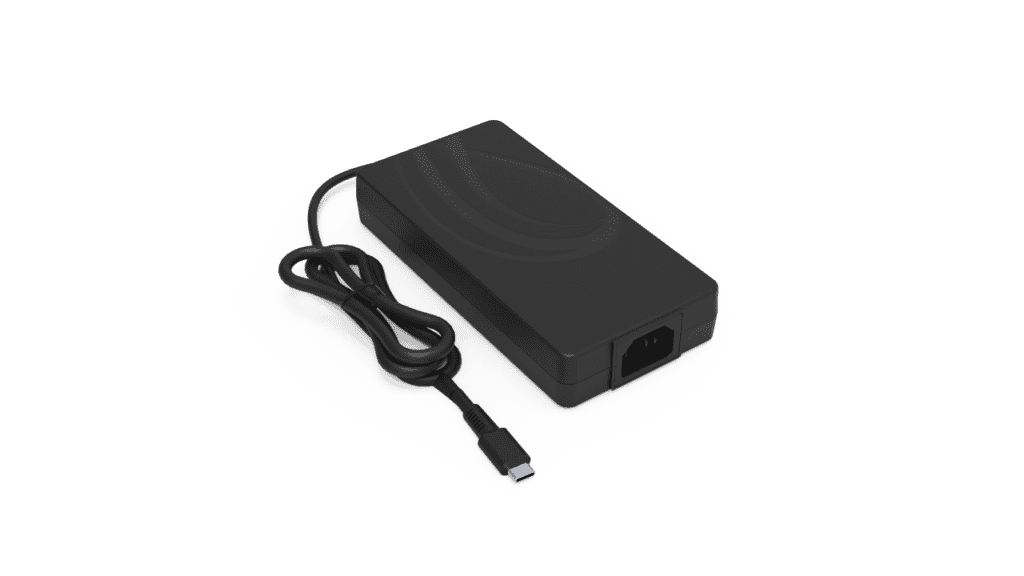
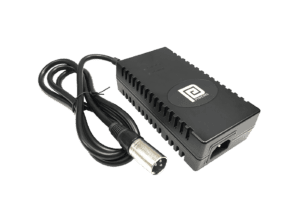
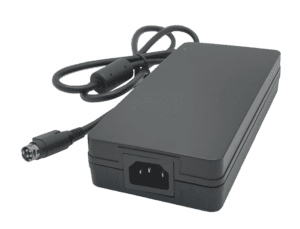
AA240U-59FKEA-R
- Output Power - 240 Watt
- Output Volt - 5Vdc/ 9Vdc/ 15Vdc/ 20Vdc/ 28V/ 36V/ 48V
Look for noise introduced by the probe connection
A long return connection creates a larger loop that can pick up interference and add inductive effects to the measurement. A prominent spike on the display may therefore include a measurement artifact. Use an appropriately rated probing arrangement with a suitable low-inductance connection at the defined low-voltage boundary. The correct choice depends on the grounding arrangement and equipment, not just on which accessory produces the smallest trace.
Keep the probe and its return connection away from unrelated noise sources where the agreed setup permits. Confirm probe compensation and attenuation settings, and document any fixture used to reach the connector. A probe tip and return connected at one location should not be treated as the same boundary as a pair of long wires running to another point on the bench.
Never lift protective earth or defeat a safety connection to improve a ripple image. If the measurement needs a differential or isolated method, use equipment designed and rated for the task. This article concerns a controlled output measurement by qualified personnel; it does not provide instructions for accessing mains circuitry or opening the adapter.
Why This Matters
- The observed trace can contain both real output behavior and probe-induced artifacts.
- A cleaner-looking waveform is not evidence that an unsafe probing arrangement is acceptable.
What OEMs Should Do Now
- Use a suitable rated probe and minimize the unintended loop within the approved setup.
- Document the exact connection and preserve the grounding arrangement required for safe measurement.
Check acquisition settings and the instrument noise floor
A small ripple signal riding on a large DC output challenges vertical resolution and probe selection. Attenuation, vertical range, coupling and bandwidth affect the observed signal and noise floor. Set the instrument appropriately for the test and retain those settings. Do not assume an automatically chosen range gives enough detail to judge a result near the limit.
Trace averaging may reduce non-repeating noise or obscure occasional events. A peak-detect mode may reveal excursions that another display mode does not. These functions answer different questions, so identify the acquisition mode in the report. Keep the unprocessed comparison record required by the approved method; use additional display processing as labeled diagnostic evidence rather than silently changing the pass/fail basis.
Evaluate the measurement system’s own contribution using a suitable approved check. If the noise floor is a substantial part of the apparent result, improve the method or include that limitation in the disposition. Do not subtract a guessed noise amplitude from a peak-to-peak reading. Measurement uncertainty needs an explicit treatment, particularly when the result lies close to the requirement.
Why This Matters
- Instrument configuration can dominate a small signal or conceal an intermittent excursion.
- A borderline value needs a defensible method rather than an improvised numerical correction.
What OEMs Should Do Now
- Save coupling, attenuation, vertical scale, acquisition mode and bandwidth with the capture.
- Check the measurement contribution and agree how uncertainty affects near-limit results.
Change one setup variable at a time to isolate a false failure
Start from the original capture and hold the adapter, profile, input and load constant. Change one measurement variable, such as the probe connection or the specified bandwidth setting, while recording what changed. If multiple variables move together, a lower reading cannot be attributed confidently to any one improvement. Keep a comparison log so the investigation remains reproducible.
A result that changes strongly with probe placement points toward a measurement contribution, but it does not prove the adapter has no real noise. Repeat the defined setup and look for the event that remains. Conversely, a stable result above the applicable limit with a suitable method deserves product review. The purpose of the controlled comparison is to separate contributions, not to search indefinitely for a passing screenshot.
Keep ripple separate from startup overshoot or a load-step dip. Those events may appear in a wide acquisition but have different test definitions. The adapter datasheet measurement guide provides that broader distinction. State whether the result is a steady operating ripple test or an event capture so the reviewer can apply the right requirement.
| Comparison | Keep fixed | Change explicitly |
|---|---|---|
| Probe contribution | Profile, input and load | Connection geometry |
| Bandwidth effect | Unit and fixture | Documented bandwidth selection |
| Reproduction check | Agreed complete method | Repeat acquisition only |
Why This Matters
- Changing one variable preserves a usable explanation of why the result moved.
- A method correction should retain any real remaining event rather than erase the original complaint.
What OEMs Should Do Now
- Build a short before/after log with unchanged operating conditions and named setup differences.
- Escalate persistent excursions with the complete approved method and original data.
How Phihong supports a defensible ripple review
Provide the AA240U-59FKEA-R revision, profile, input, load, fixture, connector capacitor arrangement and complete acquisition settings. Include both the initial trace and the matched-method repeat, with clear labels. Ask whether the measurement boundary and capacitor placement reproduce the intended source method before treating a discrepancy as a component failure.
The current project specification and agreed test method should control acceptance. Public product information is a starting reference, not confirmation of current inventory or universal suitability for a receiver. If additional fixture instructions are required, resolve them before converting the measurement into an incoming inspection rule. A repeatable setup is more valuable than a one-time trace that nobody else can reproduce.
Connect the final disposition to the 240W USB-C production-validation record, keeping component ripple evidence separate from device-level immunity or functional tests. For broader interface context, refer to the USB-IF Power Delivery overview. That reference explains the protocol landscape; it does not establish this model’s measured ripple or a finished product’s certification.
Why This Matters
- A complete setup record helps Phihong compare equivalent measurements.
- An agreed inspection method prevents probe-related disagreements from recurring across production sites.
What OEMs Should Do Now
- Request clarification of any unresolved fixture or endpoint detail before acceptance testing.
- Retain the accepted setup, representative trace and result with the qualification evidence.
Useful Links: AA240U-59FKEA-R product details · AA240U-59FKEA-R technical datasheet
Related Links: 240W EPR test-correlation guide · Surge capture and averages · Load-step voltage dips · Ripple and datasheet test definitions · 240W validation evidence · EPR system-design guide
Frequently Asked Questions
Should I use full oscilloscope bandwidth for the datasheet comparison?
The AA240U method lists 20MHz. A wider-bandwidth capture may be useful for investigation, but label it separately and use the agreed method for the specification comparison.
Are the SPR and EPR ripple limits the same?
The source production-test pages list 200mVp-p for SPR and 300mVp-p for EPR. Match the profile and its associated operating condition before applying the value.
Can a long probe return create an apparent spike?
It can contribute pickup and inductive artifacts. Use a suitable rated probing arrangement and compare controlled setups while preserving the original evidence.
Can I simply average the trace until it passes?
No. Averaging changes what the display reveals and may hide non-repeating excursions. Use the acquisition method agreed for acceptance and label any processed diagnostic view.
What if the correctly configured test still exceeds the limit?
Retain the source revision, profile, load, fixture, capacitor placement and instrument settings with the trace. Send that reproducible evidence to Phihong for review rather than changing the criterion.