









BLOG
USB-C Surge-Load Testing: Why Can a 1ms Power Spike Be Missed by an Average Reading?
QUICK LINKS

Quick answer: USB-C surge-load testing can look normal on an average display even when the output experiences a brief dip. A 1ms high-demand interval needs event-resolved voltage and current evidence; an average over the complete repetition period answers a different question.
For the AA240U-59FKEA-R 240W adapter, the published surge cases use specific high and low intervals. Those cases should not be confused with AC input inrush, continuous overload capability or a general permission to exceed a USB-C contract. The task is to reproduce an agreed output-load waveform and observe its effect.
A practical test review starts with the waveform definition, then checks what the load actually delivered, what the instrument captured and where the minimum voltage was measured. This preserves both the supplier comparison and the separate evidence needed for your real device workload.
Read the complete surge waveform before programming the load
The AA240U model datasheet describes one surge case with a high state of 150% Ioc for 1ms and a low state of 97% Ioc for 19ms. The high interval therefore occupies 5% of the 20ms cycle. Another case uses 125% Ioc for 2ms, followed by 97% Ioc for 18ms; a third uses 110% Ioc for 10ms and 90% Ioc for 10ms. These are distinct waveforms, not three interchangeable peak ratings.
Ioc is the unresolved reference in this entry. Do not replace it with the nominal 5A profile rating and infer an absolute peak current. Confirm its intended definition, the output setup and the applicable test method with Phihong first. The entry also associates a 43.2V minimum with its surge context at 100Vac/60Hz; it is not a minimum-voltage rule for every USB-C output profile.
A test plan should preserve both levels, both durations and the repetition period. Omitting the lower state changes the energy delivered over the cycle and the available recovery interval. The waveform is the requirement context; reducing it to “150% peak” removes information needed to reproduce the result.
| Case | High interval | Low interval | High-state duty |
|---|---|---|---|
| A | 150% Ioc, 1ms | 97% Ioc, 19ms | 5% |
| B | 125% Ioc, 2ms | 97% Ioc, 18ms | 10% |
| C | 110% Ioc, 10ms | 90% Ioc, 10ms | 50% |
Why This Matters
- A peak percentage without its reference current does not define a safe or repeatable test.
- Different low-state durations change the repeated demand even when peak current looks similar.
What OEMs Should Do Now
- Resolve Ioc and output conditions before applying any surge program.
- Record high level, low level, duration, period and input condition together.
FEATURED PRODUCTS
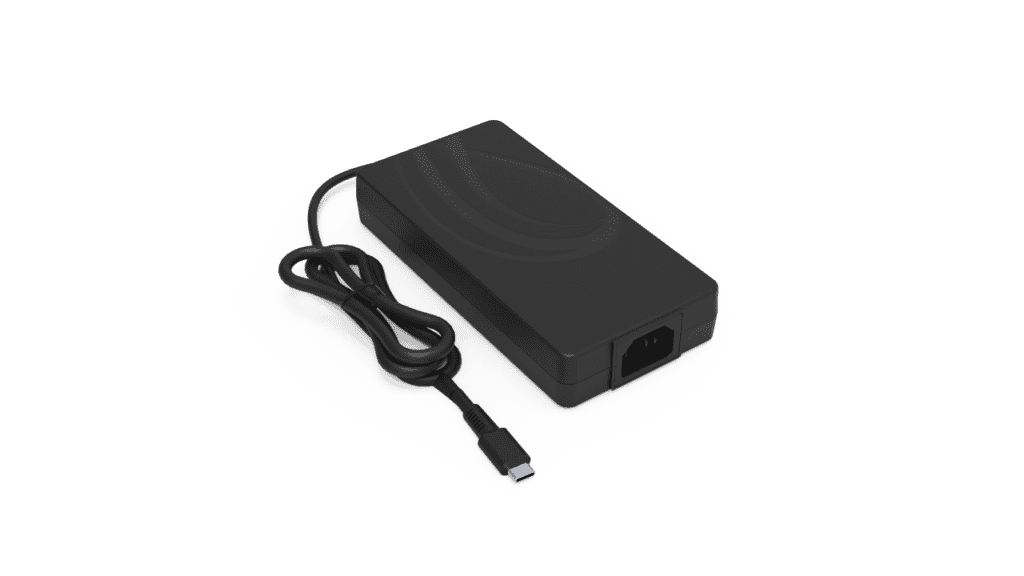
AA240U-59FKEA-R
- Output Power - 240 Watt
- Output Volt - 5Vdc/ 9Vdc/ 15Vdc/ 20Vdc/ 28V/ 36V/ 48V
Separate an average current from the instantaneous event
For a two-level periodic waveform, the time-average current is the high current multiplied by its fraction of the cycle plus the low current multiplied by the remaining fraction. When the high interval occupies only 5%, the lower state dominates the average. A front-panel number may therefore change little even though a sharp event occurs during every cycle. The average can be mathematically correct and still fail to answer the diagnostic question.
The same distinction applies to power. The instantaneous relationship is voltage multiplied by current at the same moment. Multiplying separately averaged voltage and current does not generally reproduce the average of their product when both change. For a reset investigation, the lowest relevant voltage and its duration may matter more than either average. Establish the actual device input requirement rather than assuming a single minimum applies to every receiver.
Use the averaged reading for the purpose it supports, such as describing overall demand under a defined condition. Use a time-resolved acquisition for peak-current and voltage-excursion evidence. Neither record needs to displace the other. Naming the quantity on each result avoids an argument in which two teams are both reporting valid numbers for different questions.
Why This Matters
- A stable average can coexist with a repeatable short-duration voltage excursion.
- Device reset sensitivity depends on the event at its input, not only on overall energy demand.
What OEMs Should Do Now
- Label reported values as average, peak or minimum and include their time windows.
- Capture voltage and current together before inferring event power or device margin.
Verify the delivered current pulse and the acquisition window
An electronic load’s programmed pulse is a command, not proof of the current waveform at the adapter. Response limits, fixture inductance and cabling can round an edge, shorten the high interval or introduce ringing. Use appropriately rated measurement equipment to confirm the delivered pulse at the defined low-voltage boundary. Keep the current channel time-aligned with the voltage channel so the event can be interpreted.
Configure the trigger and record length so the acquisition includes the baseline, complete high state and recovery. A record that begins after the peak cannot establish the minimum during that peak. Sample interval, record length and display processing work together: a long screen span can conceal a short event, while an aggressive averaging mode can reduce its apparent amplitude. Save the underlying acquisition settings rather than only exporting a cropped image.
A useful qualification capture shows a complete repetition period plus a closer event view. The wider view confirms timing and duty. The closer view shows the voltage response and current transition. Keep both linked to the same test configuration, and explain any processing applied. That makes the evidence useful to a reviewer who was not at the bench.
Why This Matters
- A programmed 1ms interval may differ from the pulse delivered through the real fixture.
- Trigger and processing choices can omit or soften the event being investigated.
What OEMs Should Do Now
- Measure the actual load current and retain both cycle-level and event-level captures.
- Check that the recorded time resolution and instrument bandwidth resolve the observed event.
Keep fixture effects and application failures visible
Measure at the boundary specified for the reproduction, then separately assess the receiver input if needed. A breakout board, extension or additional connector adds an electrical path. Its resistance can produce load-dependent voltage drop; its inductance can influence a fast edge. Do not attribute every difference between two sense points to the adapter, and do not remove a real device-side problem by relocating the measurement to a more favorable point.
The existing USB-C cable-resistance article explains why measurement location matters for delivered voltage. This surge test asks a narrower question: what happens during a short output event in the exact AA240U configuration? Its attached cable and any added fixture must be described. Do not transfer a detachable-cable scenario from another model without checking the physical arrangement.
If the supplier reproduction passes but the device still resets, retain the result and investigate the complete input path and downstream power behavior. If the reproduction fails, document the same waveform, conditions and boundary so the supplier can examine it. A useful disposition explains which experiment failed and what remains unresolved; it does not force all observations into one pass/fail label.
Why This Matters
- A receiver-side dip may include contributions beyond the adapter’s specified measurement point.
- Reproducing a component test and accepting a finished device are separate engineering decisions.
What OEMs Should Do Now
- Mark the supplier comparison point and device input point on the setup record.
- Track reproduction and application results separately, including any reset or recovery symptom.
How Phihong supports model-specific surge review
Bring the AA240U-59FKEA-R revision, exact surge case, confirmed Ioc definition, input condition and measured current/voltage records to the review. Include the fixture, sense locations and instrument processing. Ask whether the observed event is comparable with the published surge entry before drawing conclusions about performance. A single well-annotated capture is more useful than a collection of unrelated average readings.
Confirm availability and the specification revision for the project independently of the public product page. A listed surge test is not a guarantee of continuous overload operation, universal USB-C receiver compatibility or successful device qualification. Do not apply an unconfirmed overload to a prototype merely to see whether protection activates. Qualified personnel should work within the agreed test plan and equipment ratings.
Connect the resulting evidence to the 240W adapter production-validation plan. Record the agreed waveform and the acceptance boundary so the same disagreement does not return during incoming inspection. The USB-IF Power Delivery overview supplies broader protocol context, while the exact model source controls the specific surge comparison discussed here.
Why This Matters
- A resolved current reference turns a vague peak claim into a reproducible experiment.
- A documented method prevents different benches from repeating the same interpretation error.
What OEMs Should Do Now
- Request clarification of the exact surge method and reference current in writing.
- Retain the agreed method with the qualification record and representative captures.
Useful Links: AA240U-59FKEA-R product details · AA240U-59FKEA-R technical datasheet
Related Links: 240W EPR test-correlation guide · Load-step voltage dips · Profile-specific rise time · USB-C EPR architecture guide · Cable resistance and sense points · Production-validation evidence
Frequently Asked Questions
Is this the same as AC input inrush?
No. This article concerns a short demand at the adapter output. AC input inrush is a different event at a different electrical boundary and needs its own specification and measurement method.
Does 150% Ioc mean 7.5A on this adapter?
Do not assume that conversion. The surge entry uses Ioc without enough context here to substitute the nominal profile current. Confirm the reference and test setup before setting the load.
Why keep an average reading at all?
It can help describe overall loading and energy demand under a stated condition. It simply cannot establish the instantaneous peak current or minimum voltage during the short surge interval.
Can a device reset even if the average voltage looks normal?
Yes. A short excursion may affect the device input while contributing little to the average. Capture the event at the relevant boundary and compare it with the device’s actual input requirements.
What is the most useful evidence for review?
A time-aligned voltage/current capture, complete waveform definition, input condition, model revision, fixture description and acquisition settings. Include both the full cycle and a closer event view.