









BLOG
240W USB-C EPR Testing: Why Do Bench Results Disagree with the Adapter Datasheet?
QUICK LINKS
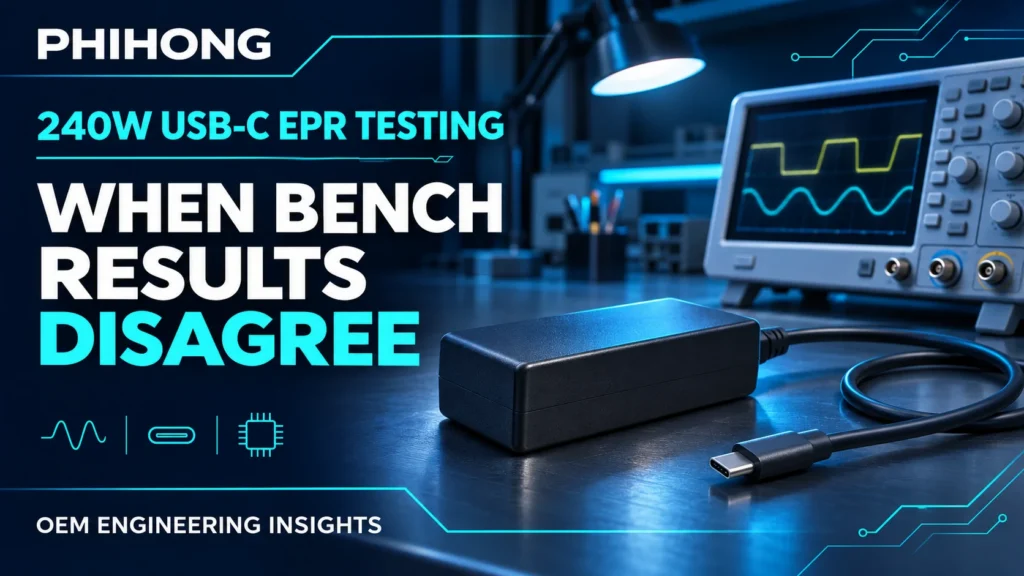
Quick answer: 240W USB-C EPR testing can disagree with a datasheet because the bench is measuring a different event, electrical boundary or load condition. Match the negotiated profile, fixture, input, load waveform and acquisition method before judging the adapter.
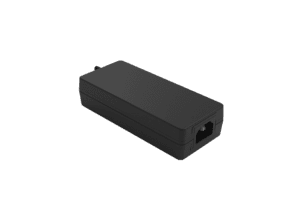
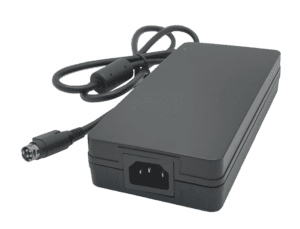
A laptop prototype resets during a burst load, yet the adapter passes a steady-load check. Another laboratory reports excessive ripple, but uses a different probe connection. Both observations deserve investigation; neither establishes that the supplier measured the same quantity incorrectly. For the AA240U-59FKEA-R 240W USB-C desktop adapter, the useful starting point is its model-specific technical data, not a generic interpretation of “240W.”
This guide separates four commonly confused measurements: output surge load, load-step response, output rise time and ripple. It provides a practical sequence for turning a disagreement into a reproducible engineering question. The examples describe published conditions, not new Phihong test results or a substitute for the current specification agreed for your program.
Define which specification the bench is actually testing
Begin with the event that caused the complaint. A steady output reading, a short voltage dip, an initial output ramp and high-frequency noise are different observations. Each needs its own time window and acceptance criterion. A single screenshot with “voltage failed” written above it leaves the reviewer unable to tell which specification was violated.
The AA240U-59FKEA-R technical datasheet separates static profile voltage ranges from dynamic response, surge behavior and ripple. Treat these as separate entries in the test plan. If a device resets while the adapter output stays inside its stated dynamic envelope, investigate the device input threshold and energy reserve as well. Passing an adapter requirement does not establish complete-device immunity.
Create two columns in the issue record: supplier reproduction and application validation. The first asks whether the published method can be reproduced. The second asks whether the finished product tolerates its real operating event. Keeping both preserves useful findings without silently changing a component requirement to fit a system symptom.
| Observation | First classification |
|---|---|
| Sustained voltage offset | Static regulation and measurement boundary |
| Brief sag after current changes | Dynamic load-step response |
| Slow initial voltage ramp | Rise-time event and load mode |
| Small repetitive spikes | Ripple, noise and acquisition method |
Why This Matters
- An incorrect acceptance criterion can turn an expected transient into a false rejection.
- A device-level failure still needs resolution even when the component meets its own stated condition.
What OEMs Should Do Now
- Name the measured quantity, observation point and applicable datasheet entry in the test request.
- Assign separate results to specification reproduction and real-device behavior.
FEATURED PRODUCTS
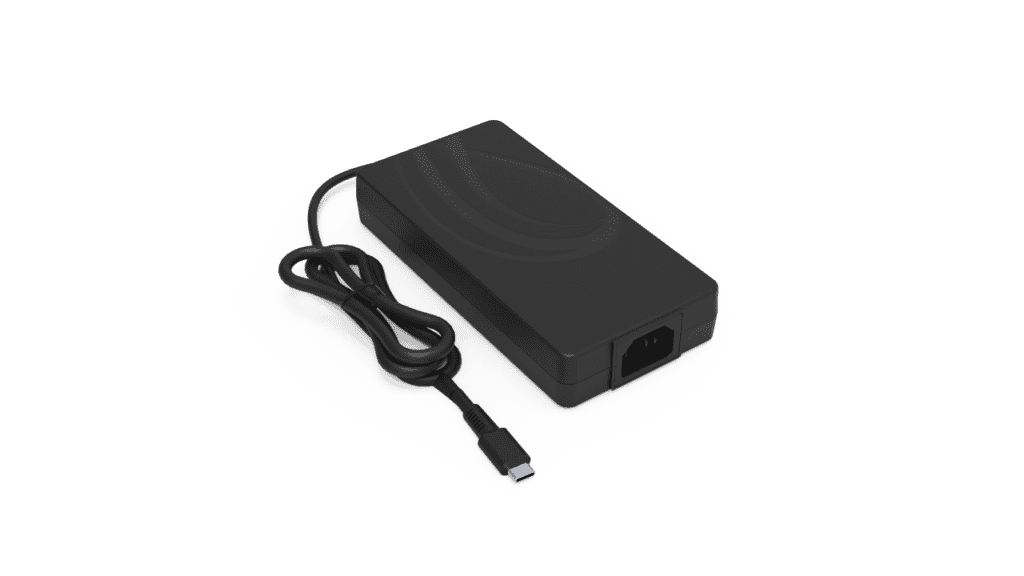
AA240U-59FKEA-R
- Output Power - 240 Watt
- Output Volt - 5Vdc/ 9Vdc/ 15Vdc/ 20Vdc/ 28V/ 36V/ 48V
Match the USB-C profile and electrical measurement boundary
The AA240U-59FKEA-R lists fixed profiles from 5V through 48V. The 240W maximum belongs to the high-power operating envelope; it does not mean every profile supplies 240W. Confirm the actual negotiated operating point using the qualified test system and retain the evidence with the waveform. The guide to 28V, 36V and 48V EPR profiles explains the broader voltage rationale.
Next identify where voltage is measured. The source document describes a Type-C cable test condition of 100mΩ for efficiency and ripple-related evaluation. Do not silently substitute a breakout board, extension lead or device connector and call the boundaries equivalent. Equally, do not subtract a guessed extra cable drop from a requirement already specified at the relevant connector. Confirm what the resistance definition includes before doing calculations.
The model has an attached output cable, so a detachable-cable replacement scenario is not the same physical configuration. Additional fixtures can introduce contact resistance, inductance and capacitance. Record their identity and the sense-point location. A photograph of the low-voltage arrangement can be more informative than another digit in the voltage reading.
| Record | Reason |
|---|---|
| Profile and delivered current | Defines the operating point |
| Attached cable plus added fixture | Defines the complete path |
| Voltage sense location | Separates adapter and fixture effects |
Why This Matters
- A valid power contract identifies the operating condition; the nameplate maximum alone does not.
- Different sense points can create a real voltage difference that is incorrectly attributed to regulation.
What OEMs Should Do Now
- Retain the negotiated profile, load level and exact adapter revision for every comparison.
- Draw the low-voltage source-to-load path and mark the voltage measurement point.
Reproduce the dynamic load before comparing voltage dips
The published transient entry specifies 100Vac and 240Vac input, 0–50% and 50–100% load steps, 1kHz repetition, 50% duty and a 1A/µs slew rate, with an output excursion criterion of ±10%. These conditions describe a particular experiment. A faster current edge, different minimum load or longer high-current interval changes the demand seen by the power stage.
Measure the actual load current at the device under test, not only the electronic load’s programmed setting. Fixture inductance and instrument limits can make the delivered transition differ from the command. Capture current and output voltage together so the reviewer can relate the voltage minimum to the current edge. Record both loading and unloading behavior, including overshoot, without changing the acceptance band midway through the review.
The hold-up and transient-response explainer covers the distinction between an input interruption and a changing output load. Here, the narrower question is whether the AA240U-59FKEA-R experiment matches its own published dynamic conditions. A prototype workload may still be worth testing, but label it as an application condition rather than a direct reproduction.
Why This Matters
- A matching average current can conceal a substantially different current transition.
- Static voltage tolerance and transient excursion answer different engineering questions.
What OEMs Should Do Now
- Save the electronic-load setup and a measured current waveform alongside voltage.
- Compare identical load intervals, input conditions and slew before classifying a mismatch.
Capture surge events without averaging away the evidence
A short output demand can disappear inside an instrument’s average display. The AA240U source includes a surge case with a 1ms high interval and a 19ms low interval, giving a 20ms period and 5% high-state duty. A meter averaging over many cycles cannot show whether the output met the requirement during the high interval. Use a qualified acquisition method that resolves the event and retains its surrounding context.
The surge table expresses current relative to Ioc and lists a 43.2V minimum in that test context. Do not assume Ioc means the nominal 5A profile rating or convert its percentages into an unconfirmed current program. The source needs to be read as a complete waveform, including its lower level, duration, input condition and intended output setup. Ask Phihong to resolve any undefined reference before applying an overload.
Trigger placement matters too. A record beginning after the current peak may show only recovery. Retain enough pre-event data to establish the baseline and enough post-event data to see the return. Avoid reporting a smoothed trace as the sole peak-evidence record; keep the acquisition settings that produced the published screenshot.
Why This Matters
- Average power does not prove the minimum voltage during a millisecond demand.
- An undefined percentage reference prevents a defensible current setting.
What OEMs Should Do Now
- Confirm Ioc and the complete model-specific surge setup before programming the test.
- Keep event-resolved voltage and current records rather than only front-panel averages.
Separate output rise time from the complete startup sequence
The AA240U rise-time entry uses a maximum of 275ms for 5V, 9V, 15V and 20V, and 700ms for 28V, 36V and 48V. Both groups are stated at full load, 100Vac/60Hz, in constant-resistance mode. These are profile-dependent limits under stated conditions. The longer figure is not a general allowance for every output profile.
The same source separately lists a turn-on delay up to 3 seconds at full load and 100Vac/60Hz. Do not merge the entries into one timer or describe rise time as total device boot time. USB-C contract activity, output establishment and downstream firmware readiness may appear in the same system trace but are not automatically the same acceptance event.
The brief rise-time entry does not fully define the start and end thresholds. An engineering plan therefore needs the agreed threshold convention and trigger reference before a borderline result becomes a pass or fail. Do not borrow a 10–90% definition from a different power supply merely because that is a familiar laboratory convention.
| Profile group | Listed maximum rise time | Stated condition |
|---|---|---|
| 5V / 9V / 15V / 20V | 275ms | Full load, 100Vac/60Hz, CR |
| 28V / 36V / 48V | 700ms | Full load, 100Vac/60Hz, CR |
Why This Matters
- Applying the wrong profile limit creates a false comparison even with a perfectly captured waveform.
- An output ramp measurement does not by itself explain when application firmware becomes ready.
What OEMs Should Do Now
- Specify voltage profile, constant-resistance load and the agreed timing thresholds.
- Keep output rise, turn-on delay and device-ready markers as separate measurements.
Check whether the ripple setup is adding the apparent failure
The model’s ripple method calls for a 20MHz oscilloscope bandwidth and a 0.1µF ceramic capacitor plus a 10µF low-ESR electrolytic at the connector. Its production-test pages list 200mVp-p for SPR outputs and 300mVp-p for EPR outputs. Preserve the profile and loading condition associated with the comparison. A full-bandwidth screenshot obtained with a different connection is useful debug information, but not automatically the stated specification test.
Long probe return paths can collect interference or produce ringing. Probe attenuation, instrument noise floor, coupling and vertical range can also change what is visible. Choose an appropriately rated probing method for the measurement boundary and grounding arrangement; do not remove protective earth or use a measurement trick to make the trace look cleaner. Keep the original record before modifying the setup.
Run a controlled comparison by changing one measurement variable at a time. If the apparent failure changes strongly with the probe loop while the load condition remains stable, investigate the measurement contribution. If the same event persists with a suitable setup and the correct bandwidth, retain it for the product review. The objective is accurate evidence, not a cosmetically smooth display.
Why This Matters
- A probe can add a visible artifact to the voltage it is intended to observe.
- Filtering away a real event and reproducing a defined bandwidth limit are different actions.
What OEMs Should Do Now
- Document bandwidth, probe, return path, coupling and specified connector capacitors.
- Retain both the original debug capture and the correctly configured comparison.
How Phihong supports a reproducible EPR test review
Use the AA240U-59FKEA-R product record and exact revision-specific source as the common reference. A useful review packet includes the unit identification, negotiated profile, input condition, measured load waveform, cable and fixture description, voltage sense point and instrument setup. Include what changed between the supplier reproduction and the application event. That makes disagreement specific enough to investigate.
Flag unresolved definitions rather than filling them with assumptions. In this source, Ioc and the detailed rise-time thresholds warrant confirmation before those tests are finalized. Ask about the measurement boundary and test fixture as well. Published product information does not establish current inventory, a project’s release status or a commitment that a particular receiver will accept every listed profile.
For the wider qualification program, connect this work to the 240W USB-C production-validation guide. The test-disagreement record should close with an agreed method and evidence, while the complete-device program separately checks its use cases. USB-IF’s Power Delivery overview provides standards background; it is not a model-specific test report or a certification claim for the equipment.
Why This Matters
- A compact evidence packet shortens clarification cycles without hiding unresolved assumptions.
- A repeatable method supports both supplier comparison and the OEM’s separate system decision.
What OEMs Should Do Now
- Send one annotated representative failure with the full setup and exact question.
- Agree the revised test definition and rerun the comparison before closing the issue.
Useful Links: AA240U-59FKEA-R product details · AA240U-59FKEA-R technical datasheet
Related Links: Surge capture and averages · Load-step voltage dips · Profile-specific rise time · Ripple probe setup · 240W EPR system-design guide · Production-validation priorities · Reading adapter test specifications
Frequently Asked Questions
Does a 240W label mean every USB-C profile delivers 240W?
No. Available power depends on the negotiated voltage and current. Confirm the supported profile and receiver behavior, then use the limits associated with that operating point.
Can I use the static voltage tolerance to reject a load-step dip?
Use the acceptance criterion for the dynamic test being reproduced. The published AA240U transient entry specifies its own conditions and excursion band; a static profile range is a separate requirement.
Is 700ms the startup limit for every output?
No. The listed rise-time maximum is 700ms for 28V, 36V and 48V under the stated full-load CR condition. Lower profiles have a separate 275ms maximum.
Can an average reading verify a 1ms surge?
An average alone cannot show the event minimum. Capture voltage and current with adequate event resolution and retain the waveform conditions used for the comparison.
What should I send when my bench result still disagrees?
Send the adapter revision, profile, input, load waveform, fixture, sense point, instrument settings and an unedited event capture. State which specification entry you believe the result exceeds.