









BLOG
USB-C EPR Transient Testing: Why Do Load Steps Produce Different Voltage Dips?
QUICK LINKS
Quick answer: USB-C EPR transient testing produces different voltage dips when the actual current transition, starting load, repetition pattern, input condition or measurement path changes. Match the complete load-step definition before comparing the depth of two dips.
A screenshot marked “50% step” is not enough to reproduce a dynamic test. The AA240U-59FKEA-R adapter source specifies load ranges, frequency, duty and slew, alongside an output excursion criterion. Each belongs in the comparison. An application workload can be valid engineering evidence while still being different from that experiment.
The most useful sequence is to establish the intended profile and static operating point, reproduce the stated current pattern, measure the delivered edge, and then examine the voltage at the defined boundary. This avoids confusing load-generator behavior with adapter response.
Define the starting and ending loads precisely
The AA240U technical data specifies both 0–50% and 50–100% load transitions. These have similar percentage spans but different starting operating points. A supply responding from a light-load state is not necessarily in the same condition as one already carrying half load. Record which range is being used rather than summarizing both as a “half-load step.”
Identify the negotiated output profile and the applicable rated load before converting the percentages into amperes. The model’s fixed profiles do not all have the same current rating. Check the actual contract and test definition; do not use the 240W family label as the baseline for every profile. Confirm that the load equipment and fixture can reproduce the intended current pattern without leaving the agreed operating condition.
Hold a steady baseline long enough for the defined test, then document the pre-step output and current. If the starting voltage is already offset because of fixture drop or another condition, a dip measured relative to nominal and a dip measured relative to the initial voltage are different numbers. State which quantity is reported so another laboratory can calculate it the same way.
| Entry to retain | Example from the source |
|---|---|
| Load ranges | 0–50% and 50–100% |
| Input comparison | 100Vac and 240Vac |
| Output criterion | Within ±10% under the listed transient conditions |
Why This Matters
- Equal percentage spans can begin from different converter operating conditions.
- An undefined baseline makes the reported dip ambiguous even if the trace is correct.
What OEMs Should Do Now
- Name the profile, reference current and both current endpoints in the test record.
- Retain pre-step voltage and identify whether excursion is referenced to nominal or baseline.
FEATURED PRODUCTS
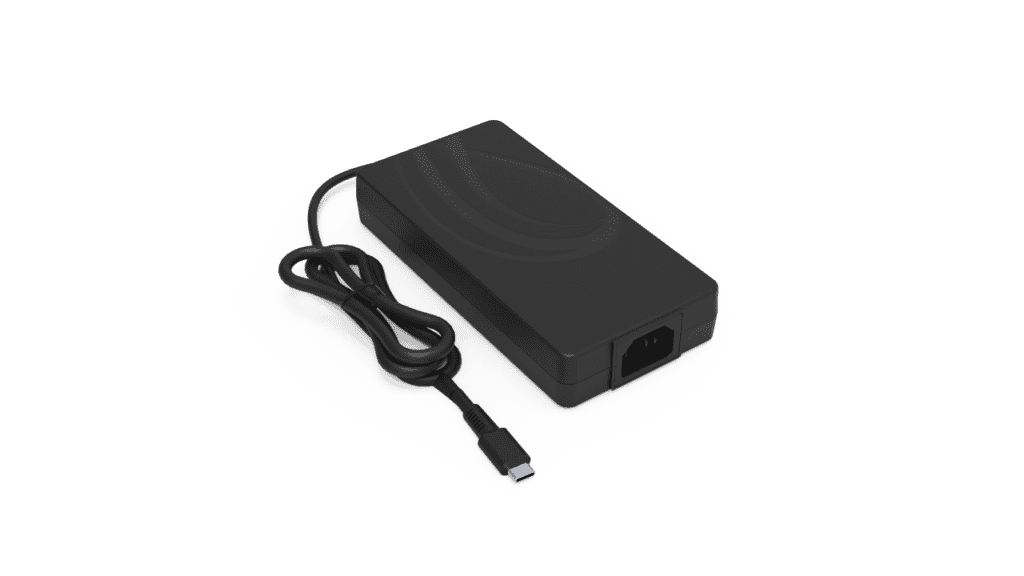
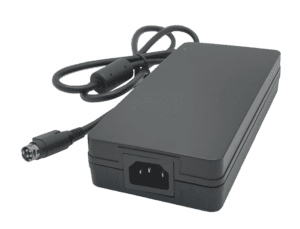
AA240U-59FKEA-R
- Output Power - 240 Watt
- Output Volt - 5Vdc/ 9Vdc/ 15Vdc/ 20Vdc/ 28V/ 36V/ 48V
Match slew rate, frequency and duty together
The listed transient conditions include 1A/µs slew, 1kHz repetition and 50% duty. Slew describes the current edge, frequency describes how often the pattern repeats, and duty describes how the cycle is divided between states. Changing any one can change the output response. A slower edge can reduce the apparent dip; a longer high interval can expose behavior that a short pulse does not.
At 1kHz, a complete cycle is 1ms. For a two-state waveform with 50% duty, each state occupies half that period. This is arithmetic describing the specified pattern, not a new hardware rating. Confirm how the electronic load defines duty and transition time so its program produces the intended delivered waveform. Some instruments include transition intervals differently in their timing displays.
Inspect loading and unloading edges. The lowest voltage after a rising current step and the highest voltage after a falling step are separate observations. Keep enough record around both to show settling and any repeated oscillation. Do not classify a test using a favorable edge alone, or combine the minimum from one configuration with the maximum from another without identifying the difference.
Why This Matters
- The edge and the time spent at each state impose different demands on the output.
- A dynamic review needs the complete repeated response, including load removal.
What OEMs Should Do Now
- Save all three waveform settings and verify their meaning on the chosen load instrument.
- Measure current during both edges and associate each voltage response with its actual transition.
Compare the delivered current rather than the load command
The commanded slew rate may not reach the adapter unchanged. Cable and fixture impedance, load response and local capacitance can alter the edge. A load control screen alone cannot establish what the power supply experienced. Measure current with a suitable method and capture it alongside voltage, using a shared time reference. Note the current measurement location and its relevant bandwidth.
Local capacitance is particularly easy to overlook. A receiver input or fixture may supply part of an initial pulse, changing the demand seen at the adapter. Conversely, an added path can produce a voltage excursion at the device connector that is absent at another boundary. Keep the configuration fixed for the reproduction and describe application variations separately. Do not add capacitance simply to obtain a passing supplier comparison.
If two benches show different dips, begin by overlaying their measured current events and comparing the electrical boundaries. A meaningful discrepancy may disappear when the current edge and sense point are matched. If it remains, the remaining question is more specific and easier to investigate. Preserve the original data so the correction to the method remains traceable.
Why This Matters
- The load setting is an intention; the measured current is evidence of the applied event.
- Fixture changes can alter both the delivered demand and the observed voltage.
What OEMs Should Do Now
- Capture current and voltage together with the fixture held constant.
- Compare the actual edge and sense boundary before treating two voltage minima as equivalent.
Apply the transient criterion without replacing system requirements
The AA240U dynamic entry uses a ±10% output excursion criterion under its listed conditions. Static profile voltage ranges are separate entries. Do not use a tighter static band as an unstated transient rule, and do not interpret the dynamic band as permission for the output to remain there indefinitely. The event, interval and operating condition determine which requirement applies.
A receiver may require a narrower input envelope than a component’s stated dynamic behavior. That is a system-integration issue to evaluate, even if the component passes its own reproduction test. The existing transient-response and hold-up guide explains why a changing output load differs from loss of input energy. Neither test substitutes for a complete receiver validation.
Report at least the nominal profile, initial voltage, minimum, maximum, load transition and acquisition settings. Include recovery behavior as an observation; do not invent an unlisted settling-time limit. If a project needs a defined recovery threshold or timing window beyond the public entry, agree that requirement explicitly before using it for acceptance.
| Result | Useful interpretation |
|---|---|
| Matched component test passes | Published condition reproduced |
| Device resets during its workload | Application margin needs investigation |
| Recovery time disputed | Agree threshold and interval before disposition |
Why This Matters
- A static tolerance and a dynamic excursion band describe different conditions.
- A component pass does not establish that the receiver has sufficient voltage margin.
What OEMs Should Do Now
- Use the stated transient band for the matched supplier reproduction.
- Validate real-device thresholds separately and agree any additional recovery-time requirement.
How Phihong supports load-step correlation
Use the AA240U-59FKEA-R product revision and source document as the review reference. Send the electronic-load program, measured current edge, output trace, profile, input condition and low-voltage fixture description. Highlight the exact difference between the published method and your experiment. This helps distinguish a setup difference from a result that still needs product investigation.
A practical correlation request includes a representative loading and unloading event, not only a cropped minimum-voltage marker. State the load instrument mode and any local capacitance or extra adapter fixture. If the actual device workload is the concern, include that record too, clearly labeled. Avoid presenting an application-specific current burst as evidence that the published 1kHz test failed when it has not been reproduced.
Place the agreed outcome into the 240W USB-C qualification record. Confirm current model availability and the revision used for the project rather than assuming the public listing establishes shipment readiness. For broader protocol terminology, the USB-IF Power Delivery overview is useful background, while model-specific limits must remain tied to the Phihong source.
Why This Matters
- Correlation works best when both parties can reproduce the same delivered current event.
- Recording the final method prevents a later test program from reverting to ambiguous settings.
What OEMs Should Do Now
- Ask for review of the full waveform and boundary, not only the voltage dip number.
- Retain the accepted method and separately document any application-specific requirement.
Useful Links: AA240U-59FKEA-R product details · AA240U-59FKEA-R technical datasheet
Related Links: 240W EPR test-correlation guide · Profile-specific rise time · Ripple probe setup · Hold-up versus transient response · 240W production validation · EPR voltage-profile selection
Frequently Asked Questions
Are 0–50% and 50–100% load steps equivalent?
They have different starting and ending operating points. Record the range explicitly and reproduce the one associated with the comparison; the percentage span alone is insufficient.
Does a programmed 1A/µs edge prove the adapter saw that edge?
No. Verify the delivered current waveform with suitable equipment. The load response, fixture and capacitance can change the current transition observed at the adapter.
Should I apply the static profile tolerance to every transient?
Use the requirement associated with the event. The AA240U source provides a separate dynamic excursion criterion with stated conditions; static voltage ranges are evaluated separately.
Can I add capacitance to make a failed test pass?
Only if it belongs to the agreed method or documented application configuration. Adding it changes the experiment and must be disclosed rather than silently improving the trace.
What if the device resets although the matched transient test passes?
Investigate the receiver input envelope and complete application workload. Preserve the component pass and system failure as separate results so both engineering questions remain visible.